Content
Groups
Applying Functions to Columns
table.apply(function_name, "Column Name")Classifying by One Variable
Suppose we have this table named cones

group method creates a table with two columns. The column is called count by default. But we can also use other functions like np.sum or np.mean to find the sum / average of the grouped category.
cones.group("Flavor")
# will result in Flavor | Count table
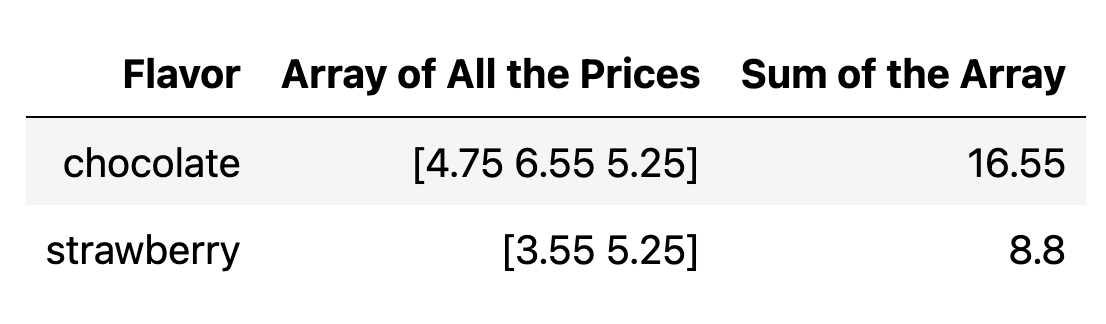
cones.group("Flavor", np.sum)
# will result in Flavor | Price Sum tableThe internal working of group
The way group works is kind of like a dictionary. It collects values of same key and then apply the given function to the value one by one. For example, if we use sum on cones table, it will be like this:
Notes : usually, the group function is used on a table with 2 columns. But, if we apply it to a table with more than 2 columns, it will categorized the data using the column that is given to the group function, and apply our custom function (default is count) to the rest of the columns. For example, this could be sum of prices, sum of reviews, etc.
But, this is not a good way of using the function group since this is not the primary purpose of the group function.
If we have more than one variable, let’s say two variables, we want to count the number in each pair. Imagine we have this new table of cones:
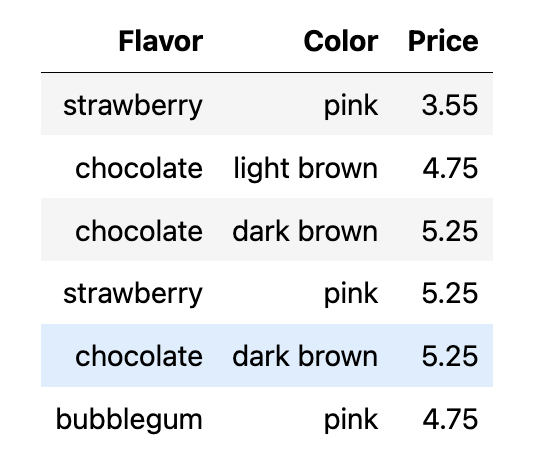
A natural way for categorizing this dataset would be to count items with a pair of category.
cones.group(["Flavor", "Color"])
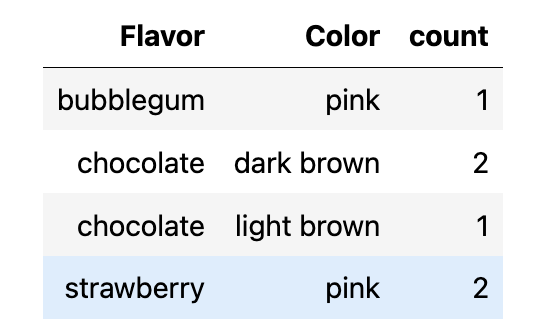
cones.group(["Flavor", "Color"], np.sum)Pivots | Cross-Classifying by More than One Variable
cones.pivot("Flavor", "Color")| Color | bubblegum | chocolate | strawberry |
|---|---|---|---|
| dark brown | 0 | 2 | 0 |
| light brown | 0 | 1 | 0 |
| pink | 1 | 0 | 2 |
pivot always take TWO column labels: one will be a row and the other a column
argument: values of pivot take a column of values that will replace the counts in each cell of the grid. The default is just count
argument: collect will be the function name. Ex: sum, np.mean